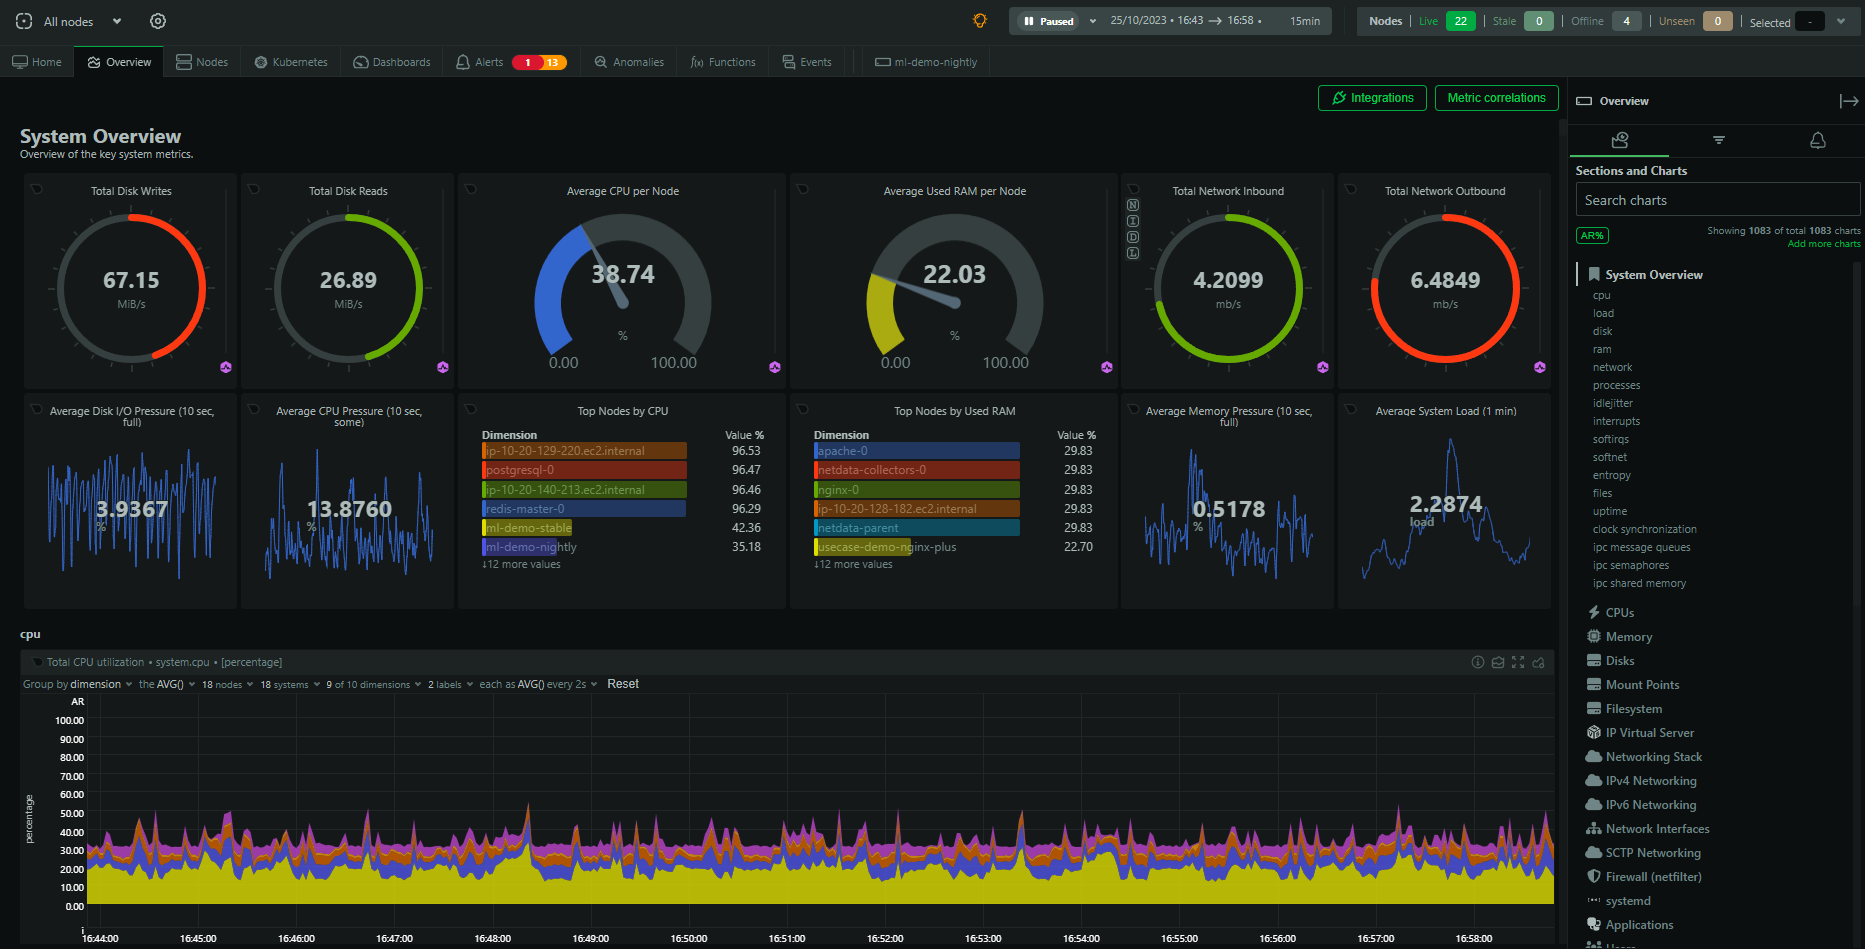
I run Netdata on the machines I care about, including a Supermicro server board whose BMC knows more about the hardware than the OS does. This is the setup guide I wanted when I started: how to install and register a node properly, how to get hardware sensors flowing — both lm-sensors and IPMI — and how alert templates actually work, including the syntax everyone copies without understanding.
Everything below was run on a live system. Where a step has a failure mode, I hit it, and I'll tell you where.
Install and register in one command
Netdata's kickstart script installs the agent and can claim it to Netdata Cloud in the same run. Grab the claim token from your Space (Add Nodes shows the full command), then:
wget -O /tmp/netdata-kickstart.sh https://get.netdata.cloud/kickstart.sh
sh /tmp/netdata-kickstart.sh \
  --claim-token YOUR_TOKEN \
  --claim-rooms YOUR_ROOM_ID \
  --claim-url https://app.netdata.cloud
Three things worth knowing that the happy path doesn't tell you:
If Netdata is already installed from your distro's packages, add --claim-only. Without it the script may decide to manage the install itself, and now you have two update mechanisms fighting over one agent.
The config-file alternative is cleaner for anything automated. Instead of flags, drop a claim.conf next to netdata.conf:
[global]
url = https://app.netdata.cloud
token = YOUR_TOKEN
rooms = ROOM_ID
Restart the agent and it claims itself. This is the right shape for Ansible, cloud-init, or a Coolify service definition — the token lives in config management, not in shell history.
Re-claiming a node (moved Spaces, cloned a VM, rebuilt a machine) requires removing /var/lib/netdata/cloud.d/ and restarting the agent first. A cloned VM that kept that directory will fight the original for the same node identity, and the symptom — the node flickering online and offline in Cloud — looks nothing like the cause.
Registration is optional, to be clear. The agent serves its own full dashboard at http://localhost:19999 with per-second granularity and no account. Cloud gives you multi-node views, alert routing, and access without a VPN. I use both: local for debugging, Cloud for noticing.
Sensors, part one: lm-sensors
For desktop and workstation boards, hardware monitoring comes from the kernel's hwmon interface, surfaced by lm-sensors:
sudo apt install lm-sensors
sudo sensors-detect   # answer yes to the safe defaults
sensors               # verify readings appear
Netdata picks this up through the go.d sensors module — the old charts.d collector is history. If sensors prints readings but Netdata shows no charts, the usual cause is the binary not being on the netdata user's PATH; point at it explicitly:
cd /etc/netdata
sudo ./edit-config go.d/sensors.conf
jobs:
  - name: sensors
    binary_path: /usr/bin/sensors
Always use edit-config rather than editing files under /usr/lib/netdata/conf.d/ — it copies the stock file into /etc/netdata/ and your changes survive upgrades.
Sensors, part two: IPMI, where the real data is
On server boards the interesting numbers — every voltage rail, every fan, chassis intrusion, PSU state — live in the BMC, and the OS-level sensors see a fraction of them. Netdata reads the BMC through the freeipmi plugin:
sudo apt install freeipmi netdata-plugin-freeipmi
sudo ipmimonitoring | head -5   # test the BMC directly, before blaming Netdata
ID   | Name        | Type        | State   | Reading | Units | Event
4    | CPU Temp    | Temperature | Nominal | 49.00   | C     | 'OK'
71   | System Temp | Temperature | Nominal | 38.00   | C     | 'OK'
If ipmimonitoring works, the plugin will work — it's the same library. You can also run the plugin standalone to watch it emit chart definitions:
sudo /usr/libexec/netdata/plugins.d/freeipmi.plugin 5
Note the plugin binary is setuid root with group netdata — IPMI device access needs privilege, and that permission set is intentional, not a packaging accident.
The gotcha that cost me a debugging session: on some boards the BMC is not ready to answer IPMI requests at the moment Netdata starts, the plugin fails its first attempt silently — nothing in the journal — and never retries. Every reboot: all charts fine, IPMI absent, and a manual systemctl restart netdata fixes it. I confirmed the race by comparing systemctl show netdata --property=ActiveEnterTimestamp against uptime — Netdata had entered active state in the same minute the machine booted.
Don't fix it with ExecStartPre=/bin/sleep. Delaying the whole agent blanks every dashboard to buy one collector, and 30 seconds wasn't enough on my board anyway. Fix it with a one-shot systemd timer that restarts Netdata once the BMC has settled:
sudo tee /etc/systemd/system/netdata-ipmi-fix.service > /dev/null << 'EOF'
[Unit]
Description=Restart Netdata for IPMI

[Service]
Type=oneshot
ExecStart=/bin/systemctl restart netdata
EOF

sudo tee /etc/systemd/system/netdata-ipmi-fix.timer > /dev/null << 'EOF'
[Unit]
Description=Restart Netdata 2 minutes after boot for IPMI

[Timer]
OnBootSec=120
Unit=netdata-ipmi-fix.service

[Install]
WantedBy=timers.target
EOF

sudo systemctl daemon-reload
sudo systemctl enable netdata-ipmi-fix.timer
Netdata is up and charting from second zero; the collector that depends on the BMC gets a clean second chance at boot+120.
Writing alert templates
This is where most people stop at copy-paste, and it's a shame, because the health engine is small enough to actually understand.
Health entities live in .conf files under health.d/, edited the same way as everything else:
cd /etc/netdata
sudo ./edit-config health.d/cpu-temp.conf
An entity starts with one of two words, and the difference is the single most important thing on this page:
template:attaches to a context — a chart type — and applies to every chart of that type, current and future.on: disk.spacecovers every disk, including the one you plug in next month.alarm:attaches to one specific chart ID.on: disk_space._mnt_datacovers exactly that mount.
Write templates by default. Reach for alarm: only when one instance genuinely needs different treatment.
Here's a complete, working entity for CPU temperature from the IPMI data above:
 template: cpu_temp_high
       on: ipmi.sensor_temperature_c
   lookup: average -1m unaligned
    units: Celsius
    every: 10s
     warn: $this > (($status >= $WARNING)  ? (75) : (80))
     crit: $this > (($status == $CRITICAL) ? (85) : (90))
    delay: down 5m multiplier 1.5 max 1h
  summary: CPU temperature
     info: Average CPU temperature over the last minute
       to: sysadmin
Line by line, the parts that matter:
lookup is a small query language: average -1m unaligned means "average of the last minute." You can take min, max, sum, restrict to specific dimensions (of user,system), or use percentages. The result lands in $this. If you need arithmetic instead of a query, calc: takes an expression. An entity needs at least one of lookup, calc, warn, or crit.
The warn/crit conditionals are hysteresis, not decoration. Read $this > (($status >= $WARNING) ? (75) : (80)) as: the alarm trips at 80 but only clears below 75. Without that band, a sensor hovering at the threshold flaps between states and pages you every ten seconds. Everyone copies this pattern from the stock configs; almost nobody can say what it does. Now you can.
delay: down 5m multiplier 1.5 max 1h debounces the notifications on recovery so a bouncing alert escalates its own silence instead of spamming you.
to: routes to a recipient role defined in health_alarm_notify.conf — and to: silent is the sanctioned way to keep an alert visible on the dashboard while sending nothing. Far better than deleting entities you might want back.
Two operational rules that bite people:
Overriding a stock alert means owning the whole file. If you create health.d/cpu.conf in /etc/netdata, the stock file of the same name is ignored entirely — your copy must contain every entity you still want from it, not just the one you changed. Give overrides their own filename (my-overrides.conf) unless you mean to replace the set.
Reload health without restarting the agent:
sudo netdatacli reload-health
Then verify the entity actually loaded, with your thresholds, straight from the API:
curl -s "http://localhost:19999/api/v1/alarms?all" | python3 -m json.tool | grep -A4 cpu_temp_high
If it's not in that output, the file didn't parse — and the health log will say why, which is more than the freeipmi plugin ever did.
What I'd do differently
Test the data source before the collector, every time. sensors before go.d, ipmimonitoring before the plugin. Half of all "Netdata doesn't show X" is the layer underneath not answering.
Alert on collector presence, not just values. My IPMI plugin failed silently for weeks of reboots while every dashboard stayed green. A monitoring system that loses a collector without telling you has failed at its one job — a template on the chart count, or an external check that the ipmi.* contexts exist, closes that hole.
Write the hysteresis version from the first alert. The plain warn: $this > 80 you write on day one becomes the flapping pager you debug on day thirty.
Netdata 2.10.3 on Ubuntu · netdata-plugin-freeipmi against a Supermicro BMC · go.d sensors with lm-sensors · claimed to Netdata Cloud via kickstart · health entities in /etc/netdata/health.d/, reloaded with netdatacli reload-health.